
Incredible visualization

MINDBLOWING: OSINT Expert Recreates Timeline of Operation Epic Fury in Interactive 3D Model | WATCH

Tech expert Bilawal Sidhu uses AI and open-source data to build a 4D reconstruction of the U.S.-Israeli strikes on Iran. Track "Operation Epic Fury" minute-by-minute, from the fall of Tehran’s airspace to the targeting of nuclear sites.

Photo: Bilalwal Sidhu on X

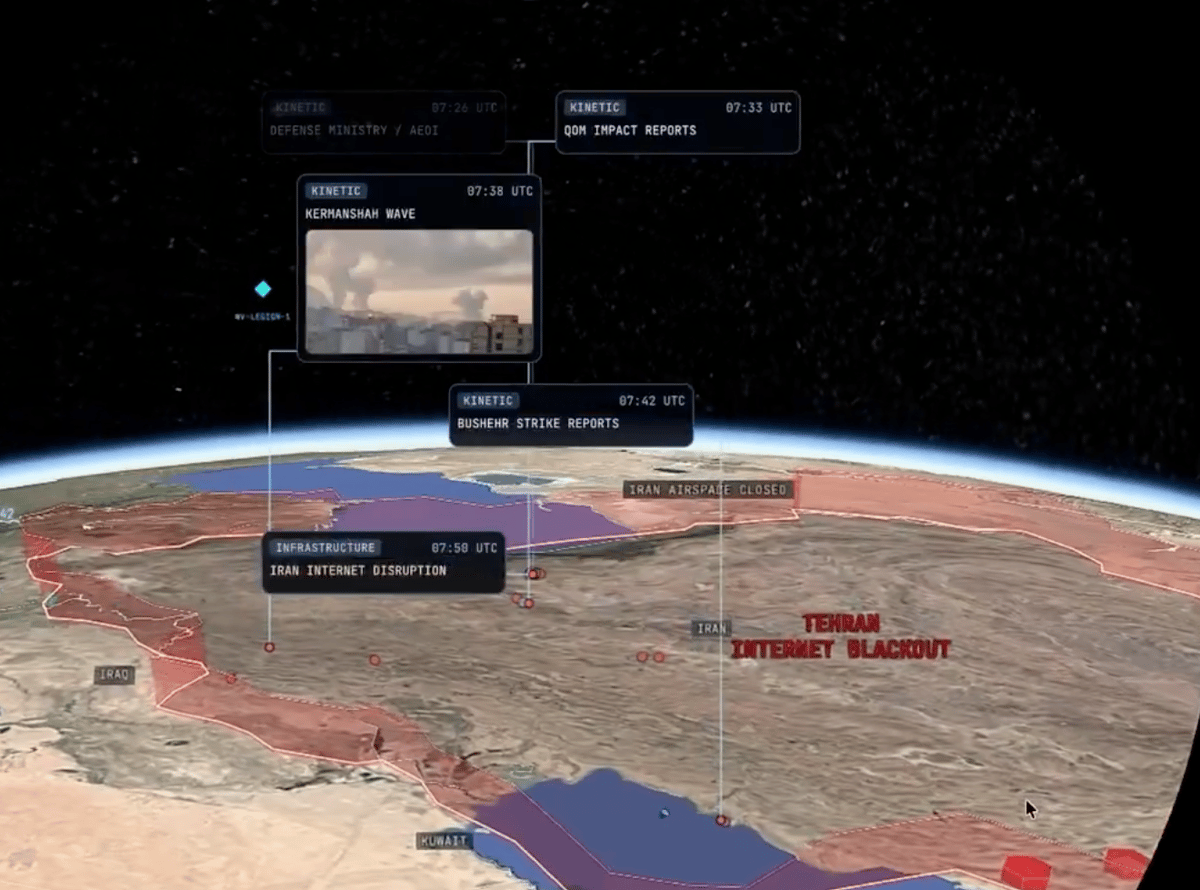
As the smoke clears from the initial waves of the U.S.-led campaign against the Iranian regime, tech curator and former Google product manager Bilawal Sidhu has released a groundbreaking 4D reconstruction of the conflict. Using an AI agent system to scrape open-source intelligence (OSINT) before it could be purged from digital caches, the model offers a minute-by-minute replay of Operation Epic Fury

The visualization, built with an AI agent system, compiles public signals into a 4D reconstruction on a 3D globe, allowing users to track events minute by minute.Operation Epic Fury, launched on February 28, 2026, involved coordinated U.S. and Israeli strikes targeting Iranian nuclear facilities, missile sites, leadership compounds, and military infrastructure.

Ready for more?

Known as Operation Roaring Lion in Israel, the campaign aimed to prevent Iran from acquiring nuclear weapons, destroy its missile arsenal, degrade proxy networks, and cripple its navy, according to U.S. officials.

Strikes reportedly killed Supreme Leader Ali Khamenei and other senior officials, with over 1,000 targets hit in the first 24 hours.

In his X post, Sidhu described deploying AI agents to capture OSINT data before it was cleared from caches, creating a comprehensive view without proprietary tools.

The model highlights key developments, including airspace clearance over Tehran, strike coordinate lock-ins, severe GPS interference across the region, satellite passes (electro-optical and synthetic aperture radar), no-fly zones in nine countries, and shipping movements at the Strait of Hormuz.

Ready for more?

Accompanying video footage shows a dynamic 3D globe centered on the Middle East, with overlays depicting red zones for strikes and interference, blue lines for flight paths and no-fly areas, and green signals for satellite activity. A timeline scrubber at the bottom enables navigation through the events, zooming from global views to specific sites like Tehran and the Persian Gulf.Sidhu, a TED tech curator with a background in AR/VR and 3D mapping at Google, emphasized the power of public data combined with computer graphics and geospatial intelligence.

He announced that his platform, WorldView, is set for release in April.

The reconstruction has garnered significant attention, with over 2.4 million views on X, amid ongoing developments in the conflict.

Iranian retaliatory strikes have targeted Israel and U.S. bases in the region, escalating tensions.

Ready for more?

Join our newsletter to receive updates on new articles and exclusive content.

We respect your privacy and will never share your information.