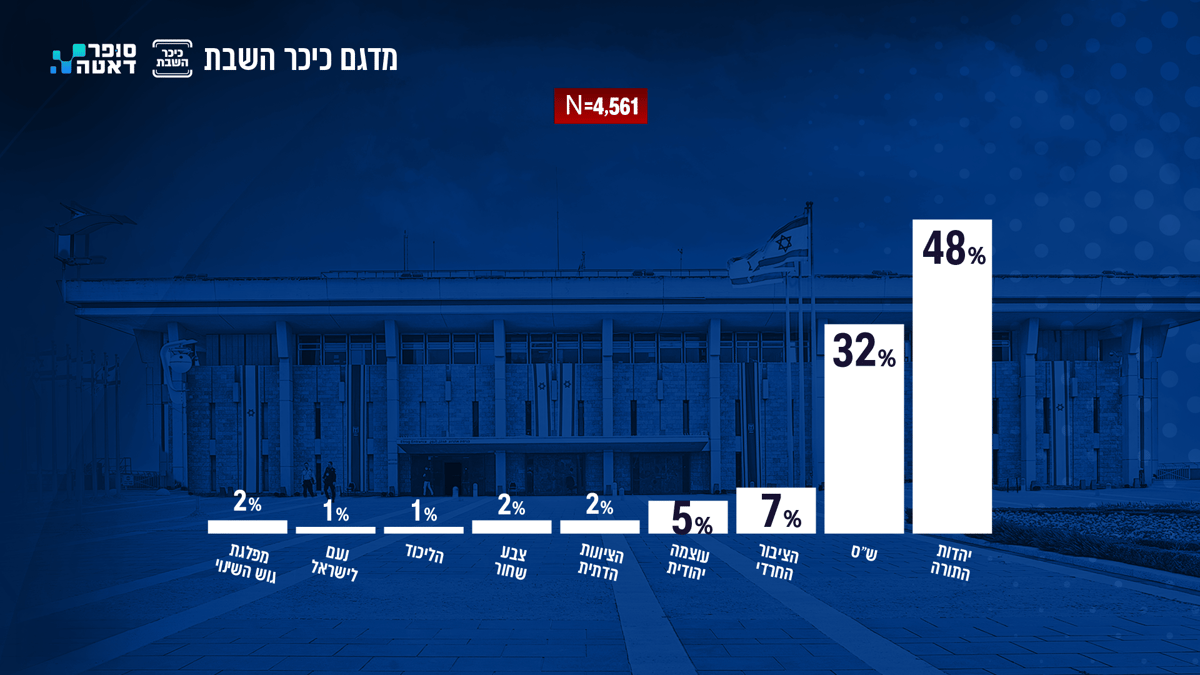
The poll is the first of its kind in chareidi media. It focuses on the chareidi public and its voting patterns: which parties chareidim voted for and how the chareidi vote divides.
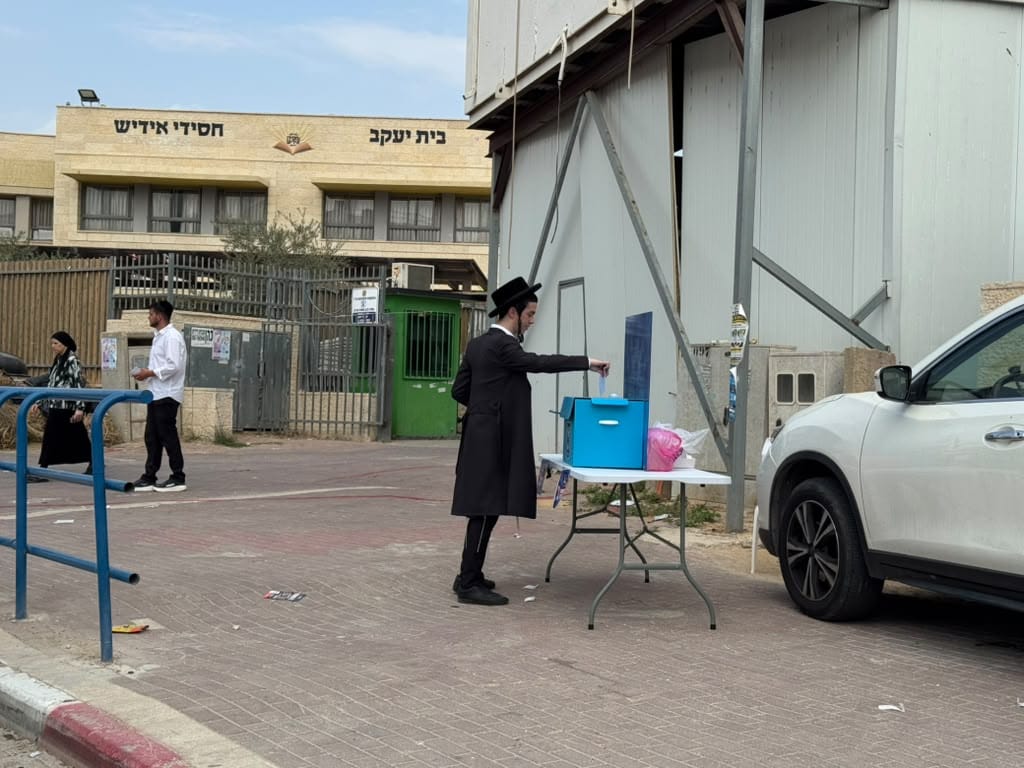
Votes were collected through sample ballot boxes at several chareidi polling stations in Bnei Brak, Jerusalem and Beit Shemesh, supplemented by an online panel.
An exit poll works by anonymously reconstructing real-time voting in a small, representative group of polling stations across the country. Unlike regular opinion surveys that predict voting intentions, an exit poll approaches people who have already left the house, made a decision and dropped a physical slip into the real ballot box. Methods vary between polling firms, but the principles are similar.
The exit-poll process has four main stages:
Selecting "key polling stations"
Research firms use mathematical and statistical models to choose dozens of individual polling stations (for example, between 60 and 70 stations out of roughly 13,000 in Israel). The selection draws on historical data and demographic characteristics, aiming to represent different regions and population groups and to create as accurate a microcosm of the entire country as possible.
The choice of stations is no less important than the number of respondents: thousands of answers from a narrow group of towns do not guarantee a good picture of the whole country. Voters from the same station also tend to resemble one another, so adding more responses from the same place is not necessarily as useful as broadening the geographic spread.
Double voting (dummy ballot box)
Outside the chosen real polling station, representatives of the polling firm set up their own station. They approach voters who have just left the official vote and ask them to recreate their vote anonymously — usually by dropping a slip into a dummy ballot box or marking the party on a tablet hidden behind a screen.
At the same time, the various firms work to collect responses through telephone interviews and online-panel questionnaires. The method of contact is tailored to different populations, with the aim of assembling a group of respondents that represents the voting public.
Data flow and weighting
Throughout election day, data from the sample stations flows continuously and electronically to the computing centres of news companies and research firms. Statisticians weight the data and make adjustments (for example, to compensate for turnout rates in certain areas that differ from expectations).
Different stations and groups may be given different weights, depending on how they were chosen and their estimated share of the voting public. The estimated vote percentages are then translated into seats, taking into account the electoral threshold and the allocation rules.
The risks and errors
Despite the impressive numbers, an exit poll can be wrong for several reasons:
Sampling error: Even a well-designed sample may, by chance, include slightly more supporters of a particular party. A different sample might yield slightly different numbers. Increasing the sample size can reduce these fluctuations, but it does not solve all the problems.
Unequal response and bias: Suppose supporters of a certain party are less likely than others to stop and answer pollsters. Their share in the responses will be smaller than their share among voters, even if many people participated in the sample. Weighting can help when there is suitable information about the source of the bias, but it does not guarantee correction of unknown differences.
For example, reporting that does not match the actual vote can also distort the picture. Therefore the sampling-error range does not necessarily cover the full possible error.
Timing matters: If those who arrive at the polls in the final hours differ from those who voted early, and their data are not fully included in the first forecast, a gap may emerge. In addition, a sample at regular polling stations does not necessarily cover voting in other frameworks well, such as military polling stations. Estimating votes not directly covered requires additional information and assumptions.
The electoral threshold: A party to which the poll attributes 3.3% may actually receive 3.2%. The difference is tiny, but its meaning can be a shift from several seats to zero, and a change in the distribution of seats among the other parties. So a forecast very close to the result in vote percentages may still miss an important difference in the composition of the Knesset.